안녕하세요 (주)씨앤텍시스템즈입니다 :)
최근 미래 유망 기술로써 2020년 핵심 기술 중 "인공지능"과 "의료빅데이터/맞춤의료"가 선정되면서 4차 산업혁명과 관련하여 더욱더 데이터와 인공지능과 바이오분야에 대해 관심이 많아지고 연구개발 또한 활발해지고 있으며, 저희도 Bigdata, OpenDataPlatform, Health Information등과 관련하여 데이터 중심의 연구개발을 지속적으로 진행하고 있습니다.
그래서 이번 포스팅에서는 인공지능과 의료빅데이터를 활용하기 위한 분석 프로그래밍의 하나인 R과 생명정보학분야에서 오픈데이터베이스로 제공되고 있는 Bioconductor를 이용하여 가볍게! 쉽게! 분석을 해볼 수 있는 시간을 가져보고자 합니다.
R이란?
- 이미 R이라는 분석 프로그래밍 언어는 너무 유명해져서 본 포스팅을 읽고 계시는 분은 알고 계시리라 짐작이 되지만 가볍게 알아보겠습니다. R은 통계 계산과 그래픽을 위한 프로그래밍 언어이자 소프트웨어 환경이자 프리웨어이며, 과거 AT&T 벨 연구소가 개발했던 S라는 언어를 참고하여 개발되었습니다. 현재는 통계 계산 뿐만 아니라 빅데이터 환경에서 대용량의 데이터를 인공지능 라이브러리와 함께 사용 할 수 있도록 더욱더 발전되고 있는 모습입니다.
R: The R Project for Statistical Computing
The R Project for Statistical Computing Getting Started R is a free software environment for statistical computing and graphics. It compiles and runs on a wide variety of UNIX platforms, Windows and MacOS. To download R, please choose your preferred CRAN m
www.r-project.org
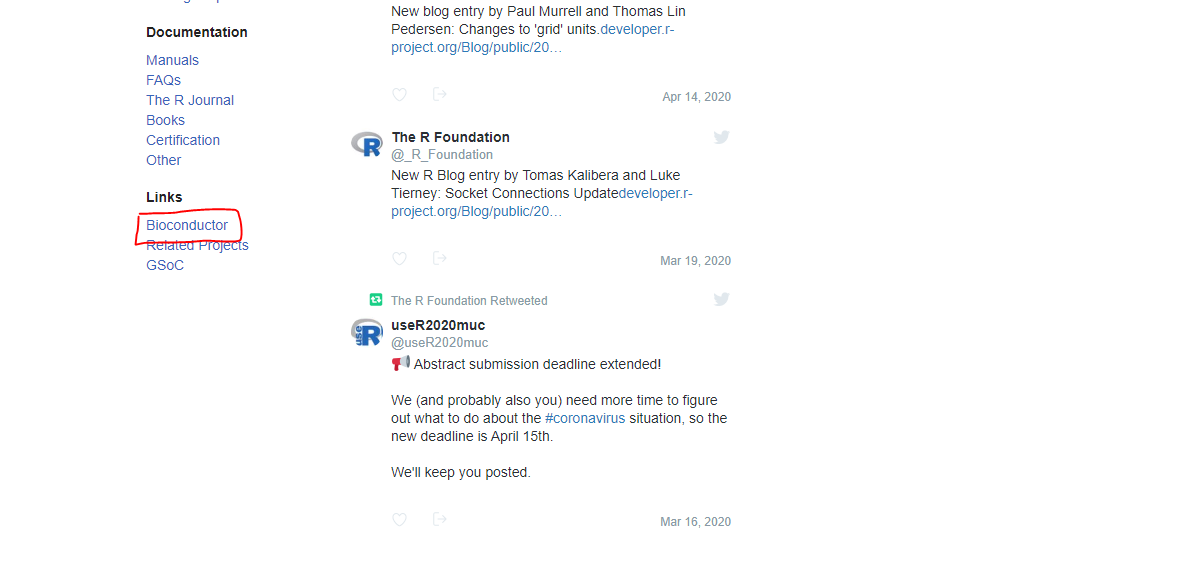
Bioconductor란?
- 바이오분야에서 종사하고 있는 분이면 이미 널리 알려진 데이터베이스이며, 분자 생물학에서 습식 실험실 실험에 의해 생성된 게놈 데이터의 분석 및 이해를위한 무료 오픈 소스 및 오픈 개발 프로젝트입니다. 주로 R과 연동하여 사용하지만 타 언어(Python 등)에서도 큰 제약 없이 사용 할 수 있습니다.

Bioconductor - Home
AboutBioconductor Bioconductor provides tools for the analysis and comprehension of high-throughput genomic data. Bioconductor uses the R statistical programming language, and is open source and open development. It has two releases each year, and an activ
www.bioconductor.org
R 설치
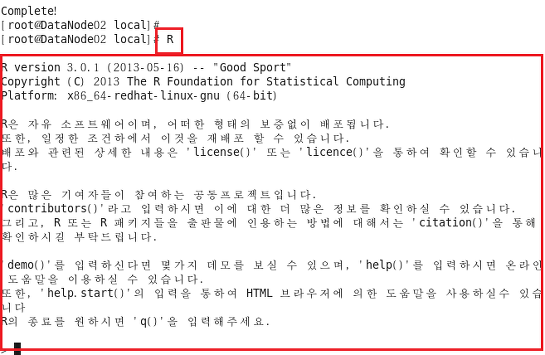
- R은 다양한 플랫폼(Windows, Linux)에서 설치하여 사용 할 수 있는데, Windows에서는 설치 파일을 받아 큰 설정없이 쉽게 할 수 있습니다. 그래서 Linux 상에서 설치 하는 방법만 간단하게 소개해 드리겠습니다.


R 사용하기
- R을 활용한 기본적인 사용법과 처리 방법은 기존의 포스팅을 참고하시면 되겠습니다.
https://cntechsystems.tistory.com/60?category=786008
R을 활용한 빅데이터 처리
안녕하세요. 씨앤텍 시스템즈 입니다. 이번 글은 R을 활용하여 빅데이터 처리해보는 과정을 정리해보도록 하겠습니다. 먼저 사용환경부터 세팅해보도록 하겠습니다. 운영체제는 윈도우 입니다. https://cran.r-pro..
cntechsystems.tistory.com
Bioconductor 설치
- Bioconductor는 현재(2020-04-20 기준) 버전 3.10이며, R 버전 3.6.0 이상에서 동작합니다.
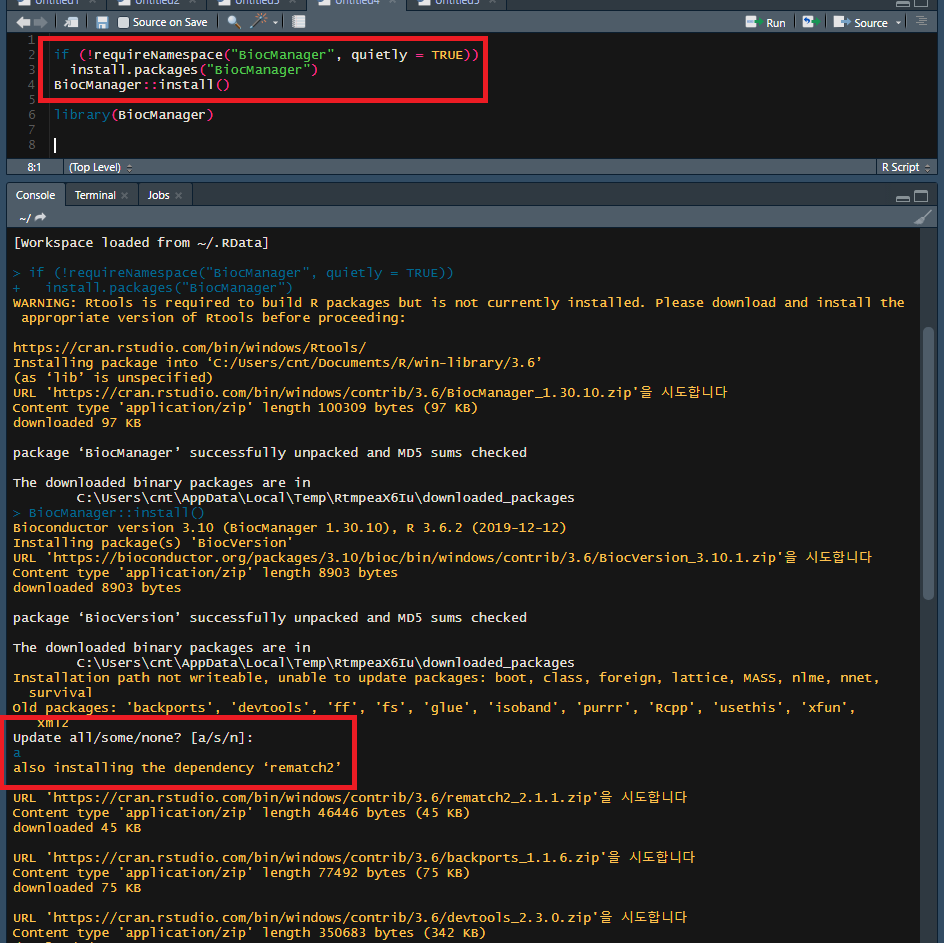
- R 실행환경에서 아래와 같이 Bioconductor 설치 코드를 입력하여 실행합니다.
- 중간에 Bioconductor와 의존성 있는 패키지를 업데이트 할 것이냐에 대한 입력이 나올 수도 있는데 본 포스팅에서는 all 을 입력하여 모두 업데이트 하였습니다.
if (!requireNamespace("BiocManager", quietly = TRUE))
  install.packages("BiocManager")
BiocManager::install()
- 특별한 에러 없이 설치가 되었으면 라이브러리를 로드하여 확인합니다.
library(BiocManager)
Bioconductor 사용하기
예제1)
- 유전자 KEGG 주석
KEGG(Kyoto Encyclopedia of Genes and Genomes)는 1995년 일본에서 만들어진 생화학 pathway 관련 데이터베이스이다. 일본에서 만들어진 DB중에는 세계에서 가장 많이 인용되는 것의 하나에 속한다.
BiocManager::install("KEGG.db")
library(KEGG.db)

myEIDs <- c("1109", "6718") # Create vecotor of input Entrez IDs
kegg <- as.character(unlist(mget(as.character(myEIDs), KEGGEXTID2PATHID, ifnotfound=NA)))
kegg <- sapply(strsplit(kegg, "hsa"), "[[", 2)
myPath <- unlist(mget(kegg, KEGGPATHID2NAME, ifnotfound=list(NA)))

myPath

KEGGPATHID2EXTID$hsa00140
KEGGPATHID2EXTID$sce00100

BiocManager::install("clusterProfiler")
library(clusterProfiler)
data(gcSample)
head(gcSample)
tail(gcSample)
genes <-gcSample[[3]]
kegg_enrichment <- enrichKEGG(genes, pvalueCutoff = 0.05)
summary(kegg_enrichment)
예제2)
- GO 농축
유전자 온톨로지(Gene Ontology)는 유전자 및 유전자 산물 속성의 표현을 통일하기위한 세계 최대 생물 정보학 컨소시엄
Gene Ontology Resource
The Gene Ontology (GO) project is a major bioinformatics initiative to develop a computational representation of our evolving knowledge of how genes encode biological functions at the molecular, cellular and tissue system levels.
geneontology.org
https://en.wikipedia.org/wiki/Gene_ontology
Gene ontology - Wikipedia
From Wikipedia, the free encyclopedia Jump to navigation Jump to search Knowledgebase for functions of genes and gene products The Gene Ontology (GO) is a major bioinformatics initiative to unify the representation of gene and gene product attributes acros
en.wikipedia.org
BiocManager::install("clusterProfiler")
library(clusterProfiler)
data(gcSample)
head(gcSample)
tail(gcSample)
genes <-gcSample[[3]]
kegg_enrichment <- enrichKEGG(genes, pvalueCutoff = 0.05)
summary(kegg_enrichment)
plot(kegg_enrichment)


BiocManager::install(c("topGO", "ALL"))
BiocManager::install("hgu95av2.db")
install.packages("Rgraphviz")

library(topGO) # loads the data library
library(ALL) # loads the data library
library(hgu95av2.db) # loads the data library

data(ALL)
data(geneList)
affyLib <-paste(annotation(ALL), "db", sep=".")
library(package=affyLib, character.only=TRUE)
myGOData <- new("topGOdata", ontology="BP", allGenes=geneList, geneSel=topDiffGenes, nodeSize=10, annot= annFUN.db, affyLib=affyLib)
Myenrichment_Fisher <- runTest(myGOData, algorithm= "classic", statistic="fisher")
Myenrichment_Fisher

score(Myenrichment_Fisher) # Displays p values for every GO term
geneData(Myenrichment_Fisher) # A table showing Medata data for enrichment

Myenrichment_KS <- runTest(myGOData, algorithm= "classic", statistic="ks")
enrich_table <-GenTable(myGOData, classicFisher=Myenrichment_Fisher,topNodes = 20)
head(enrich_table) # get the enrichment results as table

showSigOfNodes(myGOData, score(Myenrichment_Fisher), firstSigNodes=5, useInfo="all") # Plot the enrichment GO graph
gostat <- termStat(myGOData, names(score(Myenrichment_Fisher)))
plot(score(Myenrichment_Fisher), score(Myenrichment_KS)[names(score(Myenrichment_Fisher))], xlab="P values Fisher test", ylab="P values KS test", cex=(gostat$Annotated/max(gostat$Annotated))*4, col=heat.colors(gostat$Significant))
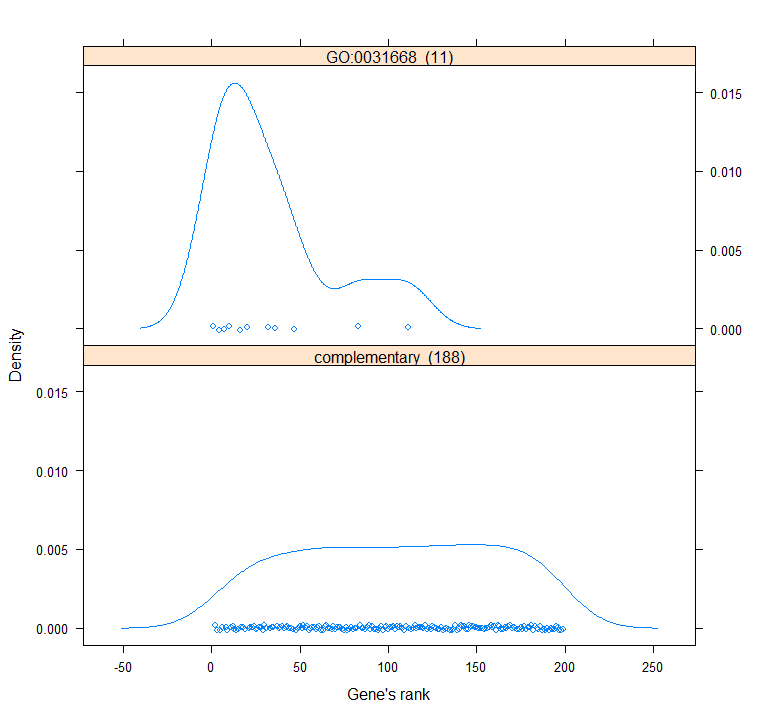
print(showGroupDensity(myGOData, enrich_table[1, "GO.ID"], ranks=TRUE))

참고
https://ko.wikipedia.org/wiki/R_(%ED%94%84%EB%A1%9C%EA%B7%B8%EB%9E%98%EB%B0%8D_%EC%96%B8%EC%96%B4)
https://en.wikipedia.org/wiki/Bioconductor
Bioinformatics with R Cookbook - 프로그래밍 코드 인용
2020년 ICT 이슈와 9대 트렌드 전망 - 한국정보화진흥원
'Data > Bigdata' 카테고리의 다른 글
| Spark SQL(Pyspark) (0) | 2020.05.26 |
|---|---|
| Spark DataFrame (PySpark) (0) | 2020.04.20 |
| Apache Spark 기능 (0) | 2020.02.13 |
| Elastic Search란? (0) | 2020.01.20 |
| Apache Spark란? (0) | 2020.01.09 |